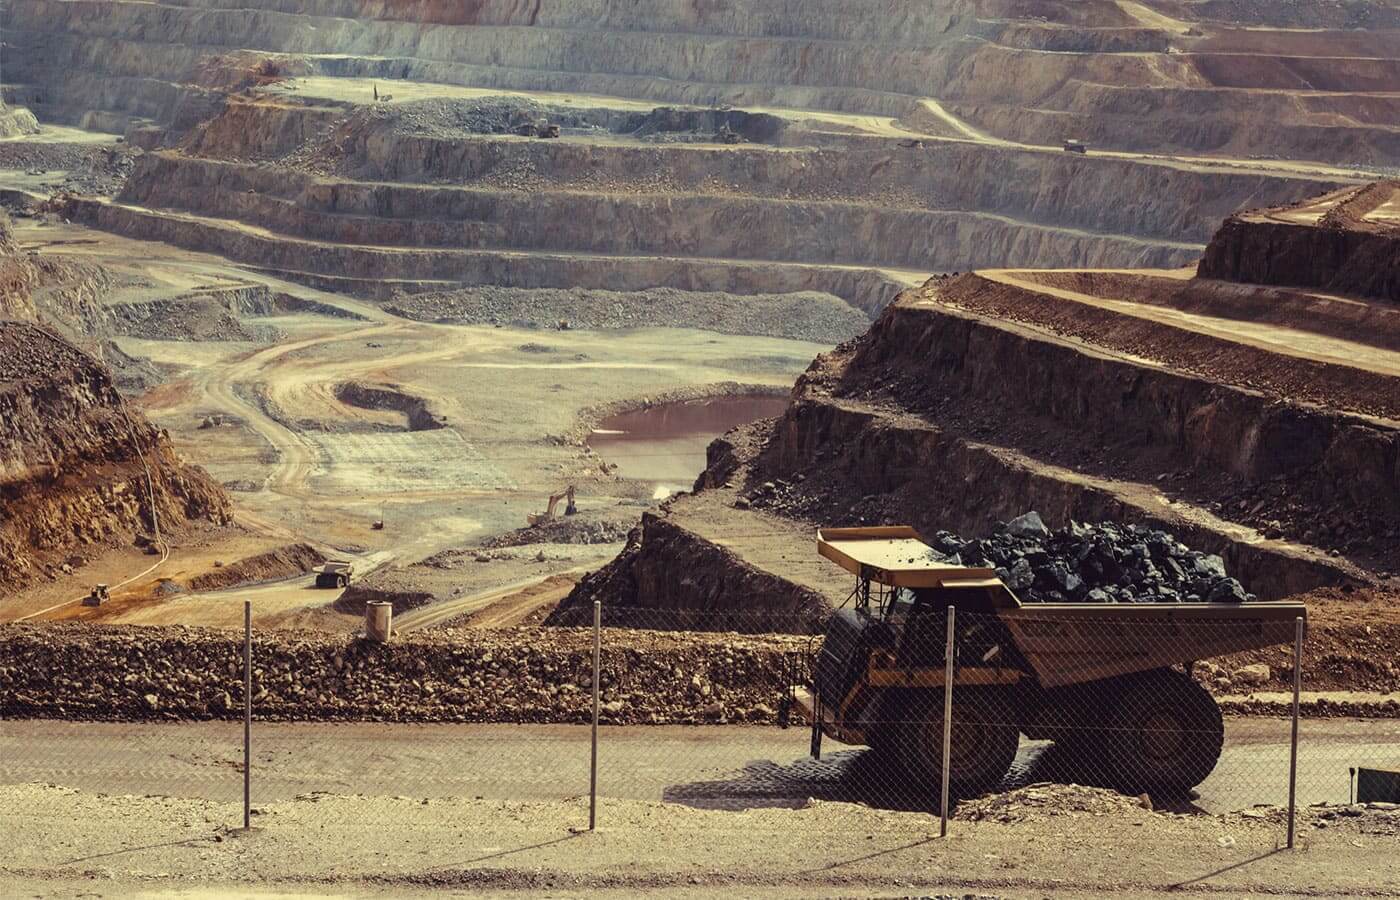
Interpreting and analysing drilling results can be quite a tough challenge. Yet, for investors thinking about investing in mining stocks or an exploration company, this is a critical skill. And while there are many factors to consider, the ore grade is arguably the easiest place to start when looking at drill results.
What is ore grade?
The grade of an ore or mineral resource is the measure of mineralisation concentration found during a drilling program. Depending on the material, it’s usually measured either as a percentage (%) per tonne or, in the case of a precious metal, grams per tone (g/t).
Understanding the concept of ore grade is pretty straightforward. The higher, the better. But often, mining companies try to pamper up their assay results by throwing around the words “high grade” in a news release even when it’s not the case. Typically this is more common among younger mining groups with a large investment in a single exploration target.
So, how does an investor know whether the reported drill hole results are actually as good as a company says?
This sort of analysis takes time and depends on many different circumstances. However, below is a compiled lookup tables that can give a rough indication of whether a mining company is trying to put lipstick on a pig when reporting drilling results for a deposit.
Base Metals & Fertilizers Drilling Results
| Material | Low Grade | Medium Grade | High Grade |
| Cadmium (Cd) | <0.2% | 0.2%-0.3% | >0.3% |
| Chromium (Cr2O3) | <20% | 20%-35% | >35% |
| Cobalt (Co) | <1% | 1%-2% | >2% |
| Copper (Cu) | <0.5% | 0.5%-1.5% | >1.5% |
| Iron Ore (Fe) | <25% | 25%-35% | >35% |
| Lead (Pb) | <2.5% | 2.5%-10% | >10% |
| Manganese (Mn) | <30% | 30%-44% | >44% |
| Mercury (Hg) | <1% | 1%-2% | >2% |
| Molybdenum (Mo) | <0.15% | 0.15%-0.5% | >0.5% |
| Nickel (Ni) | <1% | 1%-2% | >2% |
| Niobium (Nb2O5) | <0.1% | 0.1%-1% | >1% |
| Phosphate Rock (P2O5) | <25% | 25%-30% | >30% |
| Potash (K2O) | <20% | 20%-25% | >25% |
| Tungsten (WO3) | <0.3% | 0.3%-1.0% | >1.0% |
| Uranium (U3O8) | <0.15% | 0.15%-0.4% | >0.4% |
| Vanadium (V2O5) | <0.16% | 0.16%-0.39% | >0.39% |
| Zinc (Zn) | <2.5% | 2.5%-10% | >10% |
Precious Metal Drilling Results
| Material | Low Grade | Medium Grade | High Grade |
| Gold (Au) | <1.5g/t | 1.5g/t – 5g/t | >5g/t |
| Palladium (Pd) | <1.5g/t | 1.5g/t – 5g/t | >5g/t |
| Platinum (Pt) | <1g/t | 1g/t – 2.5g/t | >2.5g/t |
| Silver (Ag) | <10g/t | 10g/t – 50g/t | >50g/t |
Special Cases: Lithium (Li2O)
The ore grade of lithium is a bit more complicated than other metals because it varies depending on where it is found. Concentration within minerals or rock is usually higher than in brines. But it again varies depending on the type of rock and brine.
When announcing drilling results, mining companies often give details about the type of material it’s currently digging through to get to the lithium. With this information, the following lookup tables can again provide a rough estimate of what low, medium, and high-grade ore concentrations should look like.
| Rock & Minerals | Low Grade | Medium Grade | High Grade |
| Pegmatites (Igneous Rock) | <1.5% | 1.5%-4.0% | >4.0% |
| Hectorite (Clay) | <0.4% | 0.4%-0.8% | >0.8% |
| Jadarite (Sediments) | <1.5% | 1.5%-2.0% | >2.0% |
| Brine | Low Grade | Medium Grade | High Grade |
| Continental (Hot Springs) | <0.04% | 0.04%-0.15% | >0.15% |
| Geothermal (Steam) | <0.01% | 0.01%-0.035% | >0.035% |
| Oilfield (Waters) | <0.01% | 0.01%-0.05% | >0.05% |
RELATED: Everything investors need to know about investing in lithium stocks


