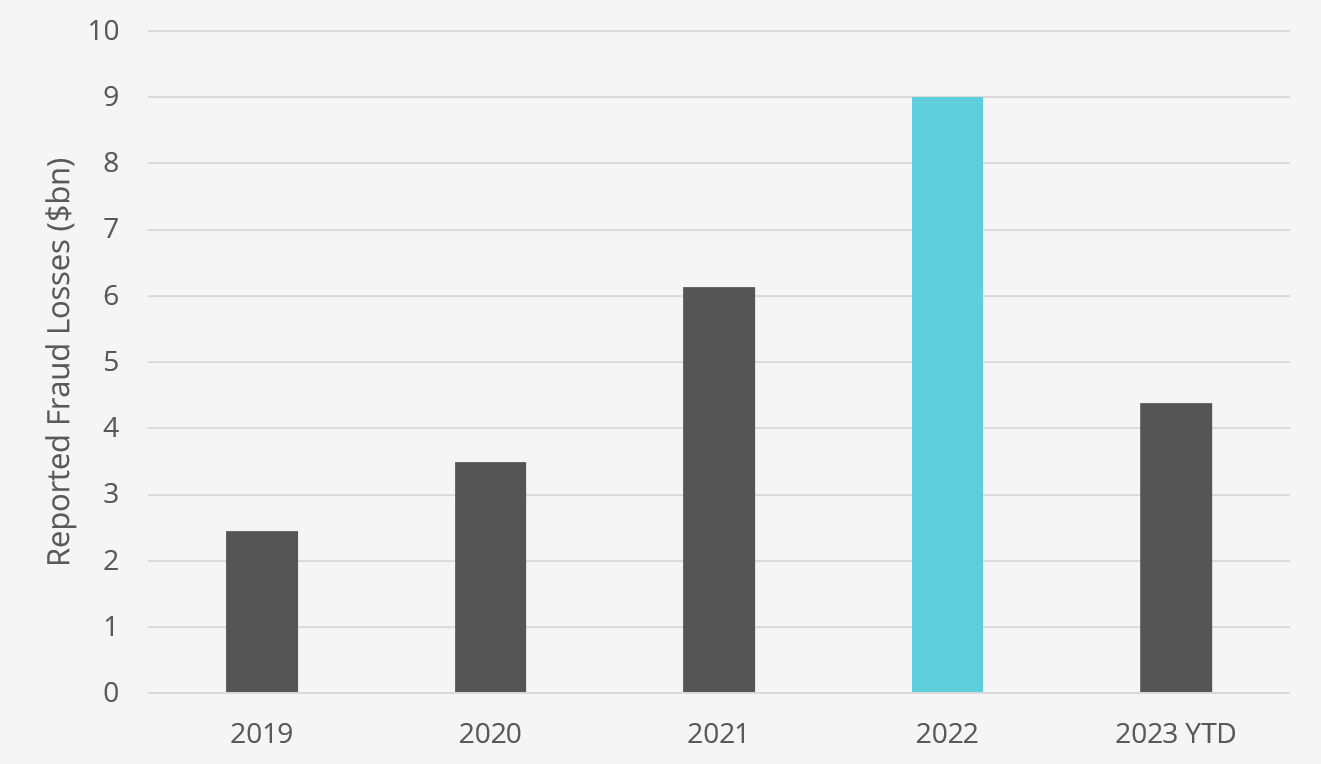
Fraud is seemingly on the rise. Last year’s correction caused many once-loved growth stocks to end up in the gutter, while numerous financial scandals have recently come to light.
In 2022, the Federal Trade Commission reported a 44% surge in scam losses, reaching as high as $9bn1!

The cryptocurrency space is no stranger to fraudsters, and a lot of attention has been getting placed on stories surrounding rug pulls, non-fungible tokens (NFTs), and, of course, the collapse of FTX – a case currently being battled in the courtrooms.
But the stock market isn’t immune to such dubious activities. While it’s certainly harder to pull off, there have been numerous instances of swindling from even the most prominent companies.
Some of the biggest names which come to mind are Theranos (2016), Wirecard (2019), Luckin Coffee (2020), Nikola (2021), and, of course, one of the biggest in history, Enron (2001).
This is far from a complete list of deceits from morally bankrupt organisations. And while the number of legitimate corporations far outweighs the scams, investors caught in such a trap can end up losing a lot of wealth.
But is there a way to detect and avoid such skulduggery?
Identifying financial shenanigans
Fraud detection is a complex process. And while all accounts presented in annual reports are audited by independent third parties, there’s always a risk of false realities slipping through the cracks. Fortunately, there’s an easy way for retail investors to spot potentially troubling numbers.
It’s called the Accurals-to-Assets ratio.
Accruals-to-Assets Ratio = (∆ Working Capital – ∆ Cash – ∆ Depreciation) / ∆ Total Assets
At its core, this metric is used to determine how efficiently a company can use its operating assets. However, it’s also terrific at detecting subtle changes in accounting policy that might be an early indicator of fraud.
How to interpret Accruals-to-Assets
Generally speaking, the lower the number, the better. And a negative value can potentially highlight extremely efficient operations. However, this figure alone doesn’t tell an investor much. Instead, it’s the trend over several years which reveals the true story.
A relatively stable value that’s trending downward suggests a company is steadily becoming more operationally efficient. Similarly, if this metric is trending upward, it indicates operational efficiency is decreasing.
Where fraud enters the mix is if the Accurals-to-Assets ratio suddenly goes through the roof. Any sudden spike in this metric must be carefully investigated and sourced back to its roots.
For example, let’s say a CEO’s compensation package is based on operational profitability. In that case, they may decide to slow the rate of deprecation to make the business appear more profitable on paper than it actually is.
A more sinister manipulation would be straight-up fraud. A firm might report a sudden growth in accounts receivable and place the blame on a temporary customer collections issue. In reality, this may be just the precursor to reporting a bogus surge in sales growth in the following period.
Beating the market average returns
Avoiding fraud is a crucial part of becoming a market-beating stock investor. And while the accruals-to-assets ratio is by no means the only detection tool out there, it’s very effective at quickly spotting strange changes in accounting practices.
That’s why it’s one of the hundreds of factors we carefully examine for our community. The Money Cog Premium service has already spotted a few questionable practices among Wall Street darlings. And by avoiding them, our investment research has helped unlock spectacular returns.
In fact, since 2015, our stock ideas have generated a staggering 798% return, translating to an impressive annualised return of 29.4%. Find out more here
Article Sources
1. Federal Trade Commission, “All Fraud Reports by Amount Lost”.


